
Harvest Reporting
and Inventory Visibility
Camvia turned Business Central data into clear harvest, inventory, and shipping reports for faster operational decisions.
Faster Reporting
Reduce manual reporting time and deliver insights in minutes instead of hours.
Inventory Visibility
See lot, quantity, inventory, and shipping information in one place.
Business Central Data
Turn ERP data into clear, consistent reporting leadership can trust.
From Manual Reporting
to Operational Visibility
Harvest, inventory, and shipping reporting depended on manual exports, spreadsheets, and inconsistent processes. Camvia replaced that fragmented approach with a connected reporting environment built around Business Central and Power BI.
The Challenge
Reporting was time-consuming, fragmented, and difficult to trust.
Manual exports were required to prepare operational reports.
Teams relied heavily on spreadsheets and disconnected processes.
Preparing harvest, inventory, and shipping reports took hours.
Leadership and field teams lacked timely, consistent information.
What Camvia Built
A connected reporting environment designed around operational visibility.
Power BI dashboards connected directly to Microsoft Dynamics 365 Business Central.
Standardized reporting metrics across harvest, inventory, and shipping.
Automated data refresh reduced repetitive manual reporting work.
Leadership gained one trusted source for operational reporting.
From ERP Data
to Decision Visibility
The reporting environment was structured to move operational data from Business Central into standardized reporting, then into Power BI dashboards built around leadership and operational needs.
Business Central Data
Harvest, inventory, lot, and shipping data begins inside Microsoft Dynamics 365 Business Central.
Reporting Logic
Metrics and reporting rules are standardized so the same definitions are used consistently across reports.
Power BI Dashboards
Power BI turns standardized ERP data into clear operational dashboards with automated refresh.
Faster Decisions
Leadership and field teams gain faster access to consistent harvest, inventory, and shipping information.
Less manual reporting, more consistent metrics, and better visibility into operational performance.
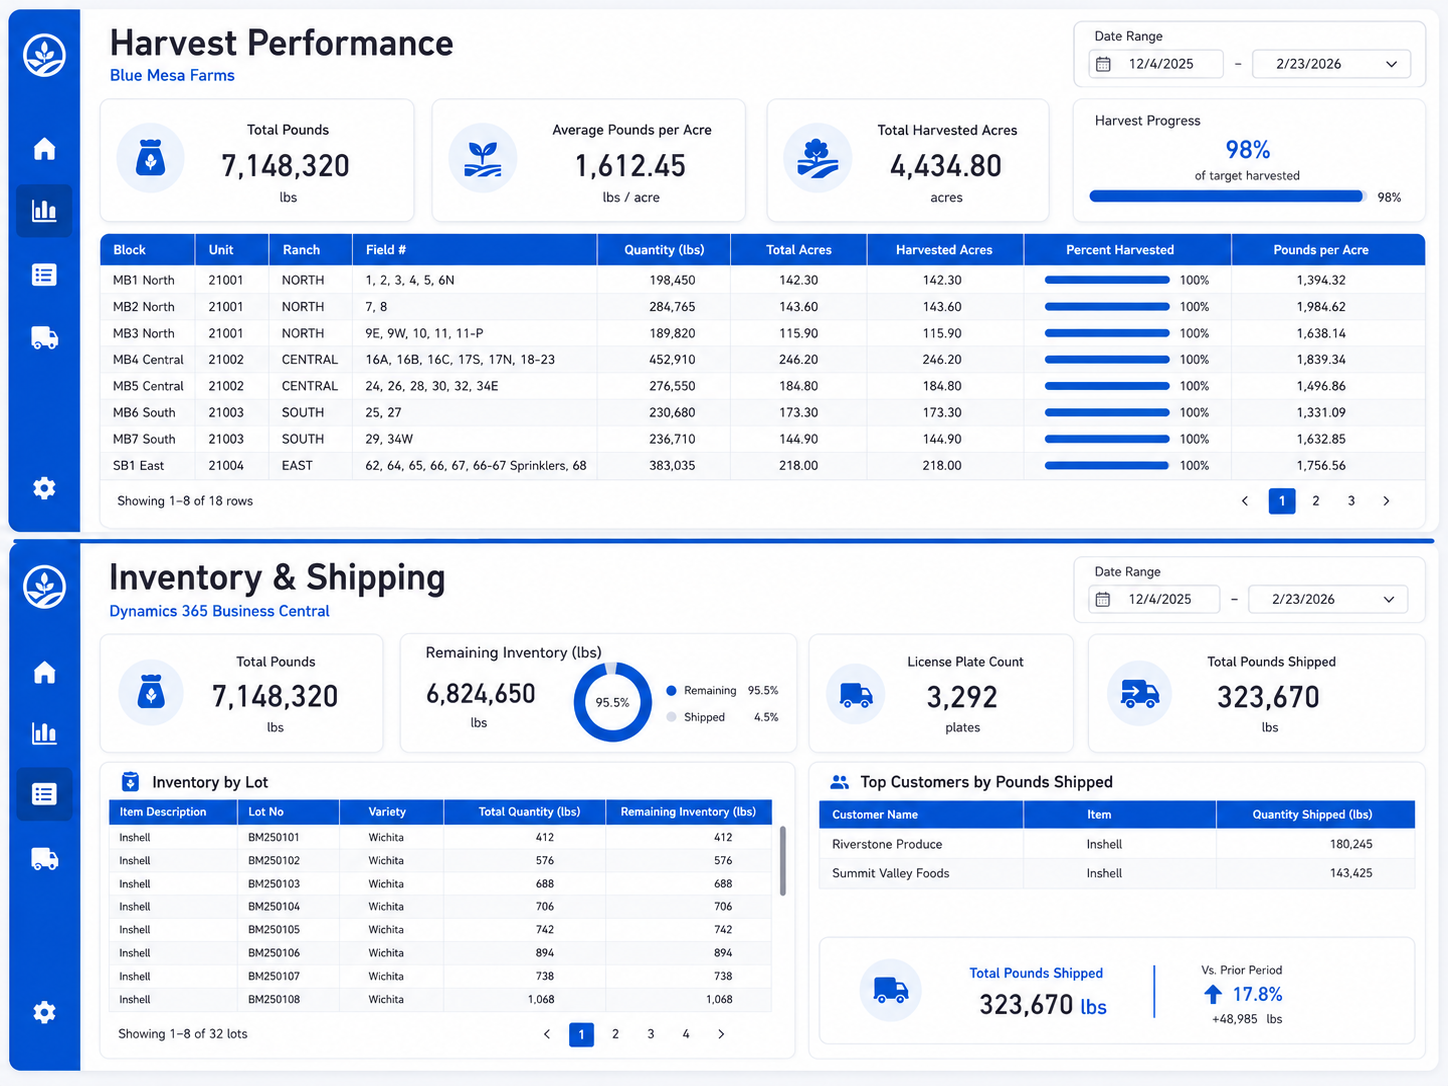
Dashboard Preview
Operational Reporting
Built for Faster Decisions
The dashboard brings harvest, inventory, and shipping information together in one place so leadership can review current performance without relying on hours of manual spreadsheet preparation.
Reduced monthly manual work and reporting time by replacing repetitive spreadsheet preparation with connected, automated reporting.
Less manual report preparation
Faster access to operational information
More consistent reporting across teams
Better Visibility.
Better Operational Decisions.
The reporting environment gave leadership and operational teams faster access to consistent information across harvest, inventory, and shipping.
Faster Harvest Visibility
See harvest results sooner without waiting for manual reporting processes to be completed.
Standardized Reporting
Use consistent reporting logic and metrics across harvest blocks, inventory, and shipping activity.
Inventory & Shipping Insight
Track current inventory and shipment activity in one reporting environment instead of across disconnected sources.
Scalable Reporting Foundation
Create a reporting structure that can support additional operational needs as the business continues to evolve.
Clearer information without adding more manual work.
Camvia transformed ERP data into an operational reporting environment designed to give leadership faster visibility, more consistent metrics, and a stronger foundation for ongoing decision-making.
Farm names, customer names, lot numbers, dates, and selected figures have been changed to protect confidential client information. Dashboard layout and reporting capabilities reflect the implemented solution.