
Retail Revenue
Intelligence Platform
Camvia created a centralized revenue and inventory reporting environment that gives leadership clearer visibility into sales performance, product activity, and inventory movement.
Revenue Visibility
Bring sales performance into one view so leadership can quickly understand revenue trends and business activity.
Performance Intelligence
Make it easier to compare revenue, product performance, and sales activity without relying on disconnected reporting.
Inventory Insight
Connect revenue activity with inventory information to improve visibility into product movement and availability.
From Fragmented Reporting
to Revenue Intelligence
Revenue, product, and inventory information was difficult to evaluate consistently when reporting lived across disconnected sources and required manual interpretation.
The Challenge
Leadership lacked a single, consistent view of revenue performance, product activity, and inventory movement.
Revenue information was spread across separate reports and data sources.
Comparing product and event performance required additional manual work.
Inventory visibility was disconnected from the revenue story.
Leadership spent more time assembling information before analyzing it.
What Camvia Built
A centralized revenue and inventory intelligence environment designed around the decisions leadership needed to make.
Revenue performance brought together into one consistent view.
Product and event performance made easier to compare and evaluate.
Inventory information connected directly to commercial performance.
Leadership given a clearer starting point for analysis and decision-making.
From Raw Retail Data
to Clear Business Insight
The reporting environment organizes revenue, product, and inventory information into a consistent structure so leadership can move from raw activity to useful analysis faster.
Revenue + Inventory Data
Sales, product, event, and inventory information begins in the underlying operational data sources.
Reporting Logic
Revenue, product, and inventory definitions are organized into a consistent reporting structure.
Intelligence Layer
Related business information is connected so revenue, product, and inventory performance can be analyzed together.
Revenue Intelligence
Standardized information is presented through a clear dashboard focused on revenue and inventory performance.
Leadership Insight
Decision-makers gain a clearer view of performance without first assembling information from disconnected reports.
Revenue, product performance, and inventory can be viewed together, creating a more useful foundation for ongoing commercial analysis.
Revenue and Inventory
in One Leadership View
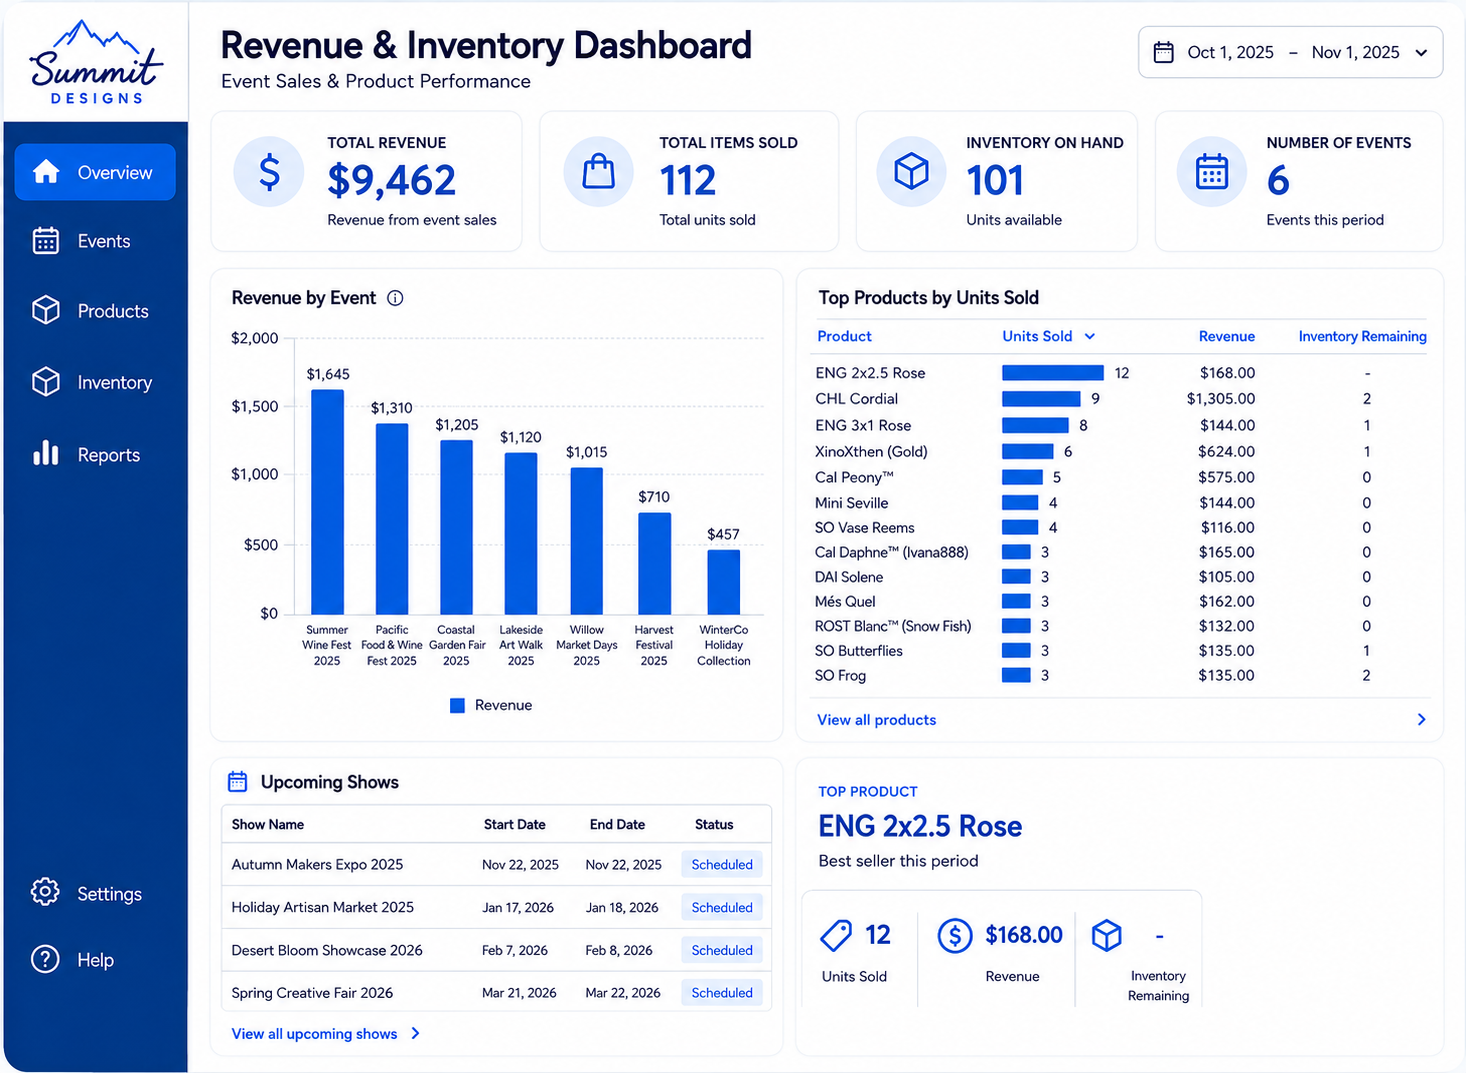
The dashboard brings together commercial and inventory information into a single reporting environment so performance can be reviewed without jumping between disconnected reports.
What Leadership Can See
The reporting layer is structured around the information needed to understand performance and identify where attention is required.
Review overall sales activity and how revenue changes over time.
Compare product activity to understand where revenue is being generated.
View inventory alongside revenue activity for better operational context.
Give leadership a consistent starting point for commercial analysis.
Customer names, product details, dates, and selected figures have been changed to protect confidential client information. Dashboard layout and reporting capabilities reflect the implemented solution.
Clearer Performance.
Faster Commercial Decisions.
The revenue intelligence platform gives leadership a more consistent view of performance while reducing the effort required to assemble, reconcile, and interpret retail reporting.
Faster Analysis
Leadership can move into performance analysis sooner instead of first spending time assembling information from separate reports.
Consistent Metrics
Revenue, product, and inventory reporting can be evaluated from a shared structure rather than relying on disconnected definitions.
Revenue Visibility
Sales and performance trends are easier to review in one place, giving leadership a clearer view of commercial activity.
Inventory Context
Inventory information can be viewed alongside revenue activity, providing more operational context around product performance.
Scalable Reporting Foundation
The reporting structure creates a foundation that can support additional analysis as business needs continue to evolve.
Business intelligence built around decisions, not just data.
Camvia transformed fragmented revenue and inventory information into a more structured reporting environment that gives leadership clearer visibility, more consistent analysis, and a stronger foundation for ongoing commercial decision-making.